G20 comprises Argentina, Australia, Brazil, Canada, China, France, Germany, India, Indonesia, Italy, Japan, Mexico, Russia, Saudi Arabia, South Africa, South Korea, Turkey, the U.K. and the U.S., as well as the European Union, represented by the rotating council presidency and the European Central Bank.
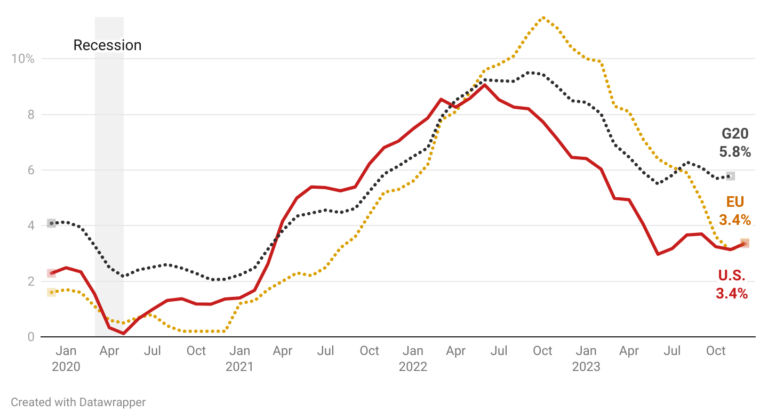
In June 2022, both U.S. and G20 inflation reached 9.1%, according to monthly inflation data from OECD. However, the EU and the U.S. diverged from the G20 trajectory that month.
The EU experienced a continuous rise in inflation until October 2022, while the U.S. maintained alignment with the G20 trend.
Interestingly, for December 2023, both the U.S. and the EU had the same monthly inflation rate of 3.4 percent while the November (most recent) inflation for G20 was 5.8 percent.
Source: OECD