Tesla is set to recall 12,963 U.S. vehicles over battery issues. The news comes at a time when the EV giant is all set to report earnings after the bell on Wednesday.
The U.S. National Highway Traffic Safety Administration has flagged a defect in some 2025 Model 3 and 2026 Model Y vehicles that could cause drivers to lose the ability to accelerate — raising the risk of a crash.
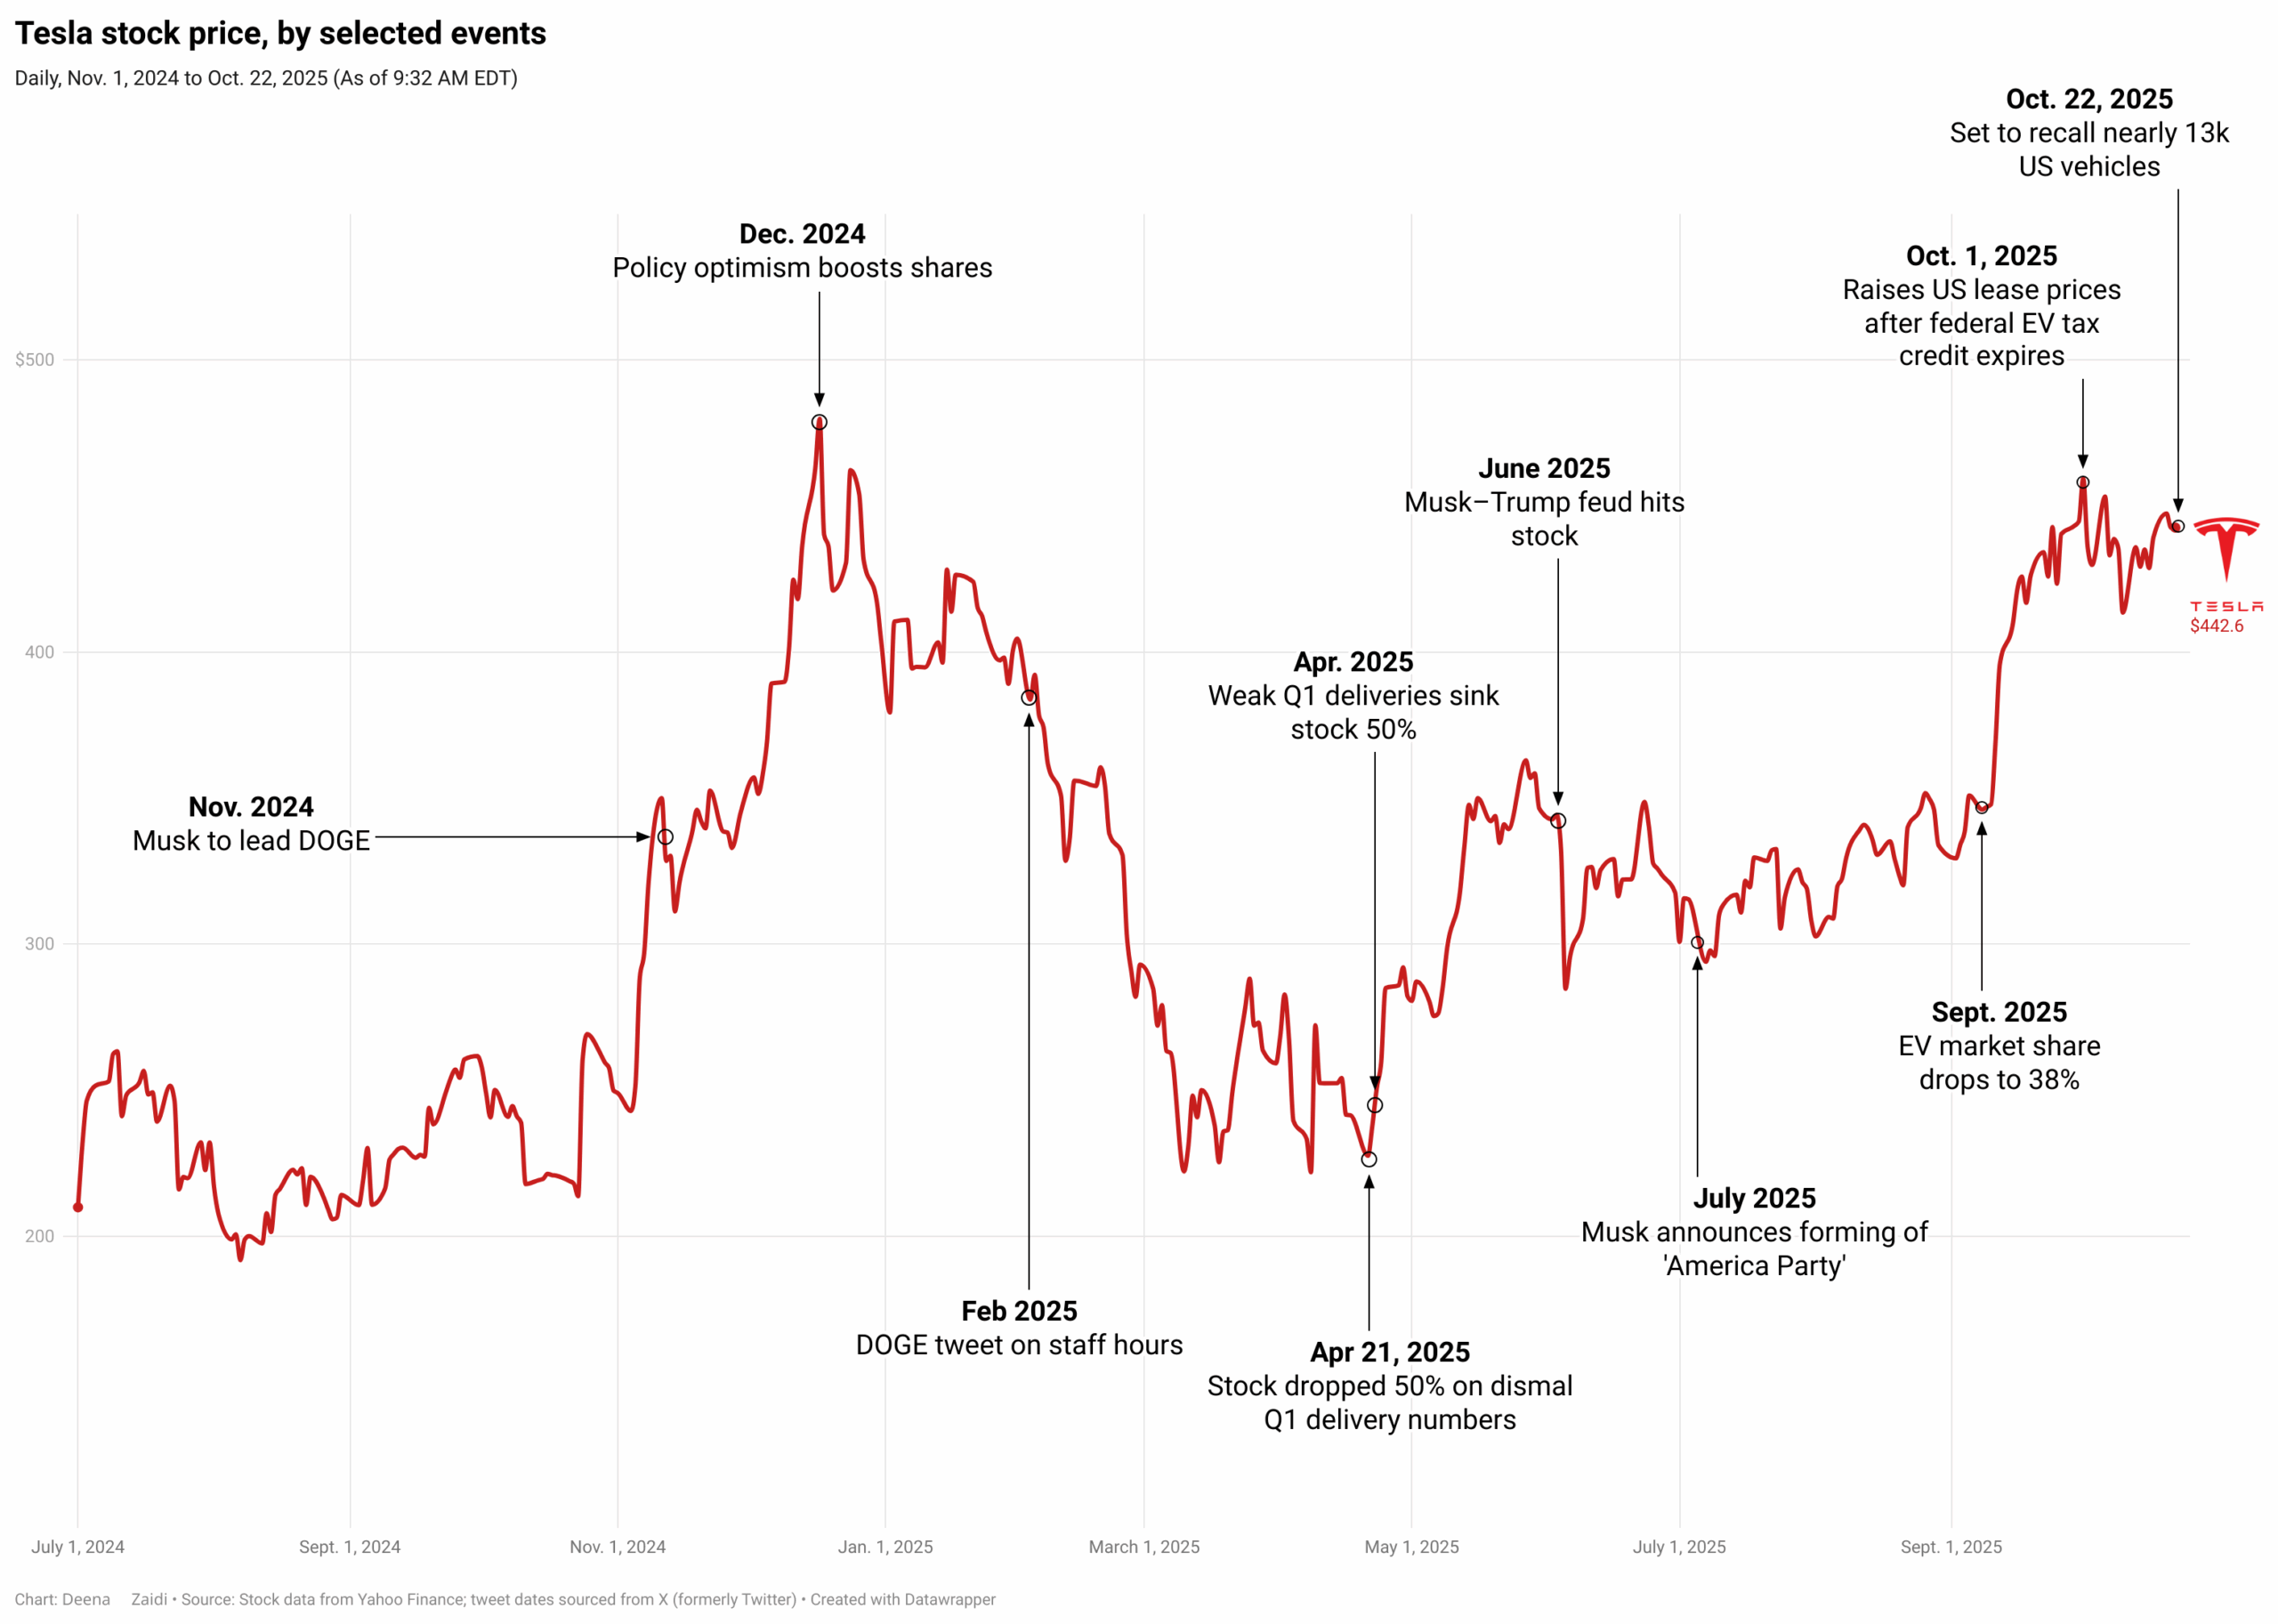
Tesla’s stock trend has been an interesting business case study for financial enthusiasts, capturing a trend that highlights not only a traditional investor pattern but also the impact of political leanings through social media interaction.
The day Trump and Musk split publicly in early June, Tesla lost about $150 billion in market value, a stark reminder that investor sentiment can shift not only with the earnings reports but also with shifting political stances. The carmaker’s shares dropped 14% that day.
By the numbers
Tesla’s quarterly deliveries fell by 13.5% year over year to delivery of 384,122 vehicles in Q2 of 2025 from 444,ooo in Q2 2024. Yet the stocks performed well closing at $315 on July 2 at the time. An aging lineup of vehicles cited as one of the reasons for Tesla’s sales decline.
However, a week later, the shares plunged nearly 8% on Monday, after Tesla’s CEO Elon Musk announced his plans of forming a new “America Party.”
The intention to create a new party was shared over the weekend on X after a public dispute with President Donald Trump on the tax-cut and spending bill.
What’s next?
So far, Musk has remained optimistic about the robotaxi business which could help steer the company’s future earnings. Musk will soon be overseeing the sales across U.S. and Europe, according to Bloomberg, which cited anonymous sources.
But Trump’s bill could pose challenges. His ‘Big Beautiful Bill’ signed into law on July 4 removed the $7,500 tax credits for EV buyers and eliminates the financial penalties for automakers that fail to meet to federal emissions targets.
Disclaimer: The writer holds shares in Tesla (TSLA)