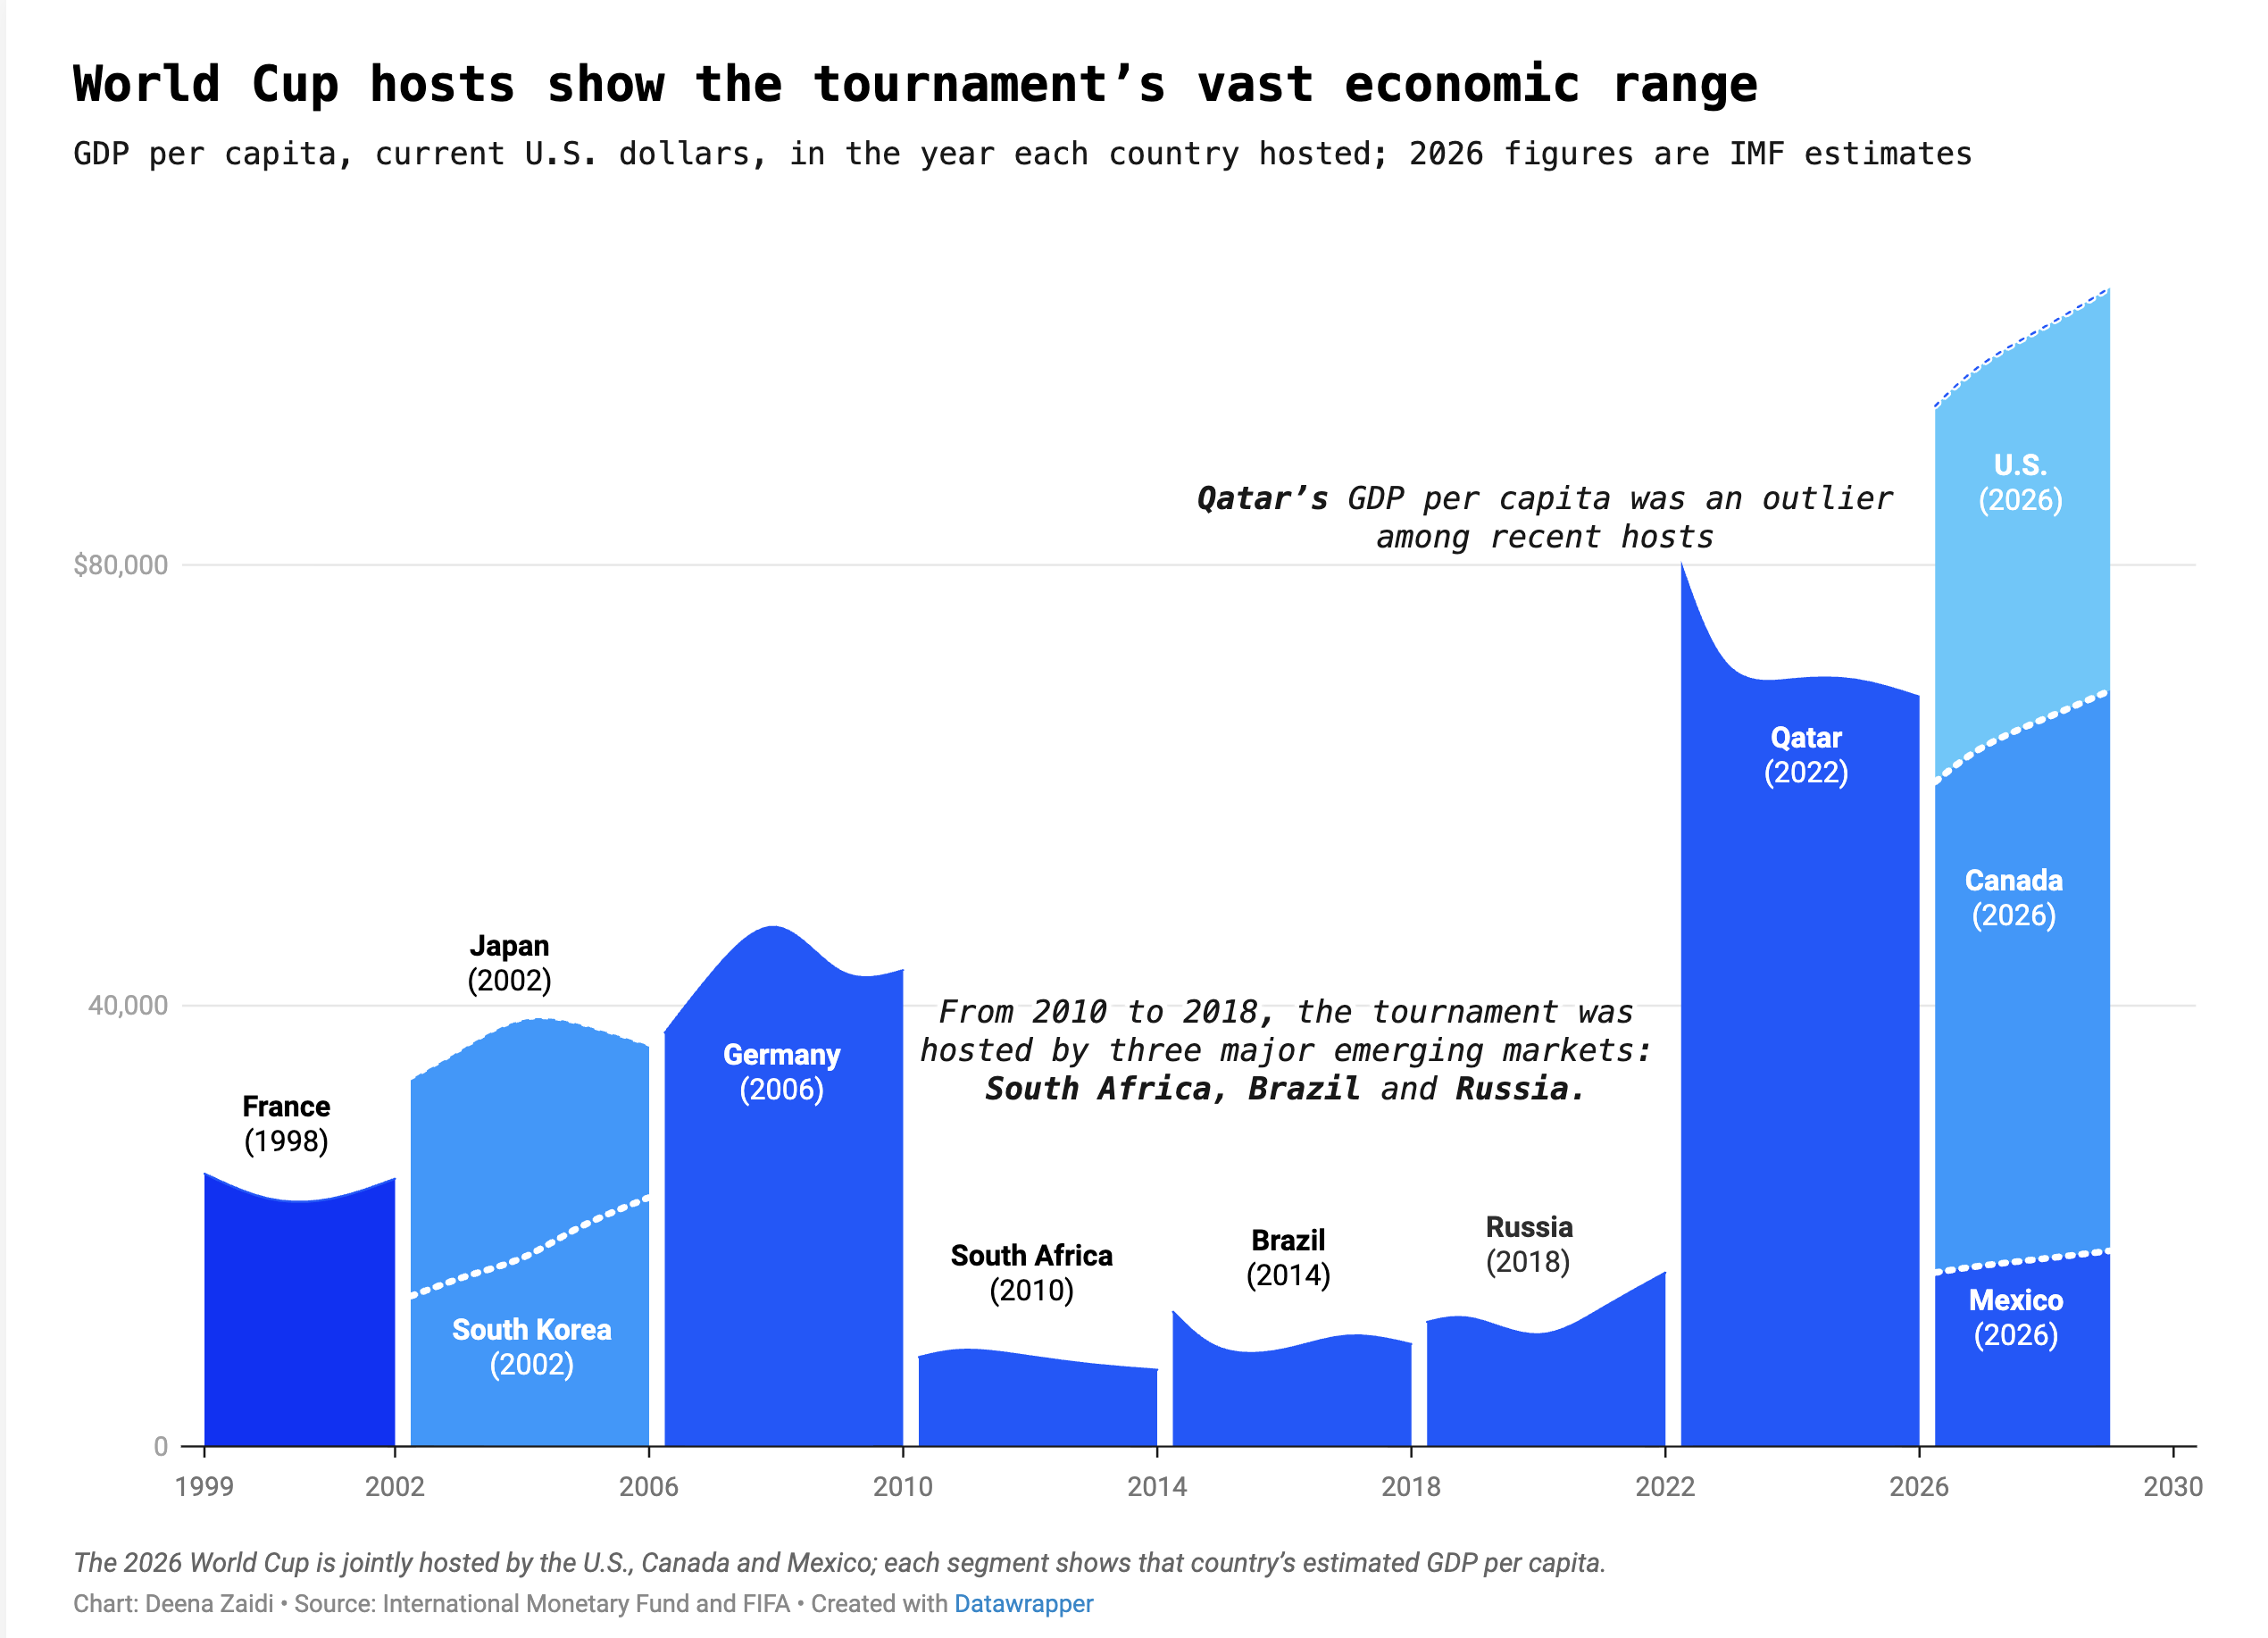
The U.S., Canada and Mexico are jointly hosting the 2026 FIFA World Cup, but IMF data shows a wide gap in GDP per capita across the three economies.
Data & financial journalist covering global economics and policy
The U.S., Canada and Mexico are jointly hosting the 2026 FIFA World Cup, but IMF data shows a wide gap in GDP per capita across the three economies.
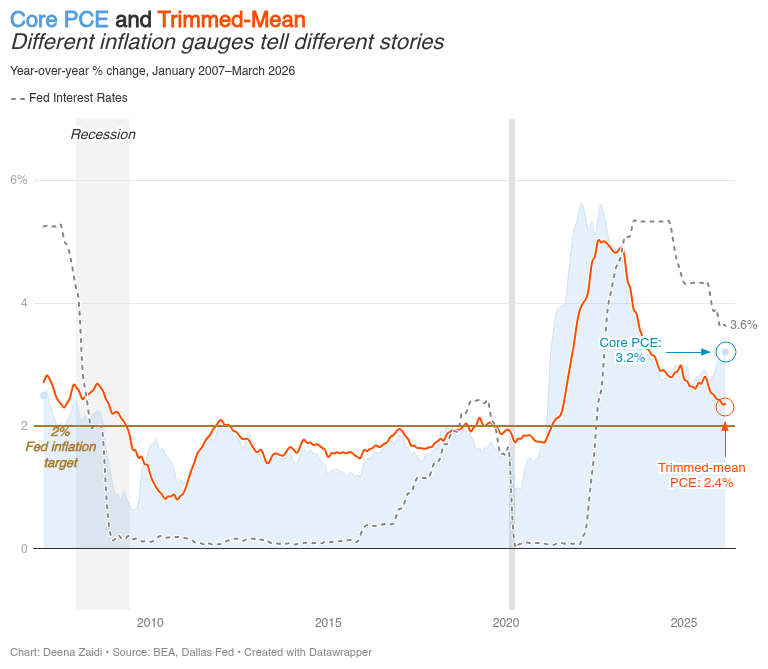
Kevin Warsh’s preferred inflation measures run well below the core PCE. A shift to a new and alternative inflation measure means strengthening the case for earlier interest rate cuts.

OPEC is no stranger to exits. But UAE’s exit could mean a fundamental geopolitical shift in the Middle East (and the oil markets).

The curious case of the 2% inflation target and why most central banks won’t let it go.