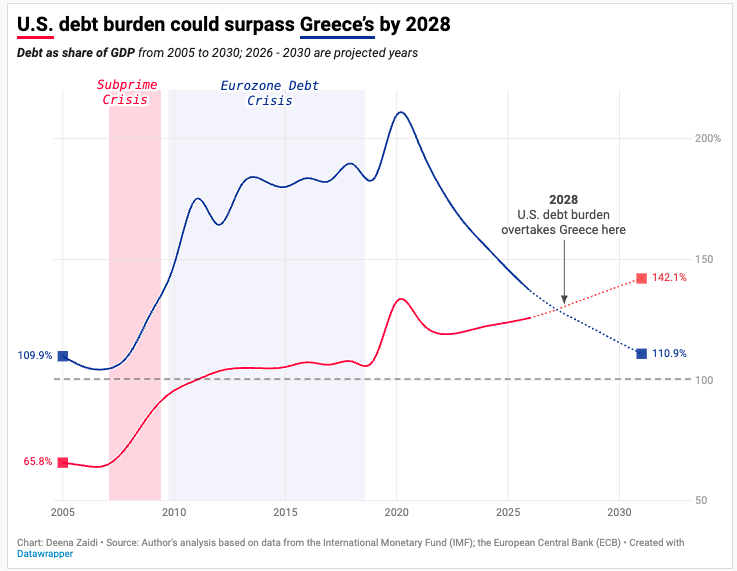
The country once mocked for fiscal collapse may soon look more disciplined than the world’s largest economy.
Data & financial journalist covering global economics and policy
The country once mocked for fiscal collapse may soon look more disciplined than the world’s largest economy.
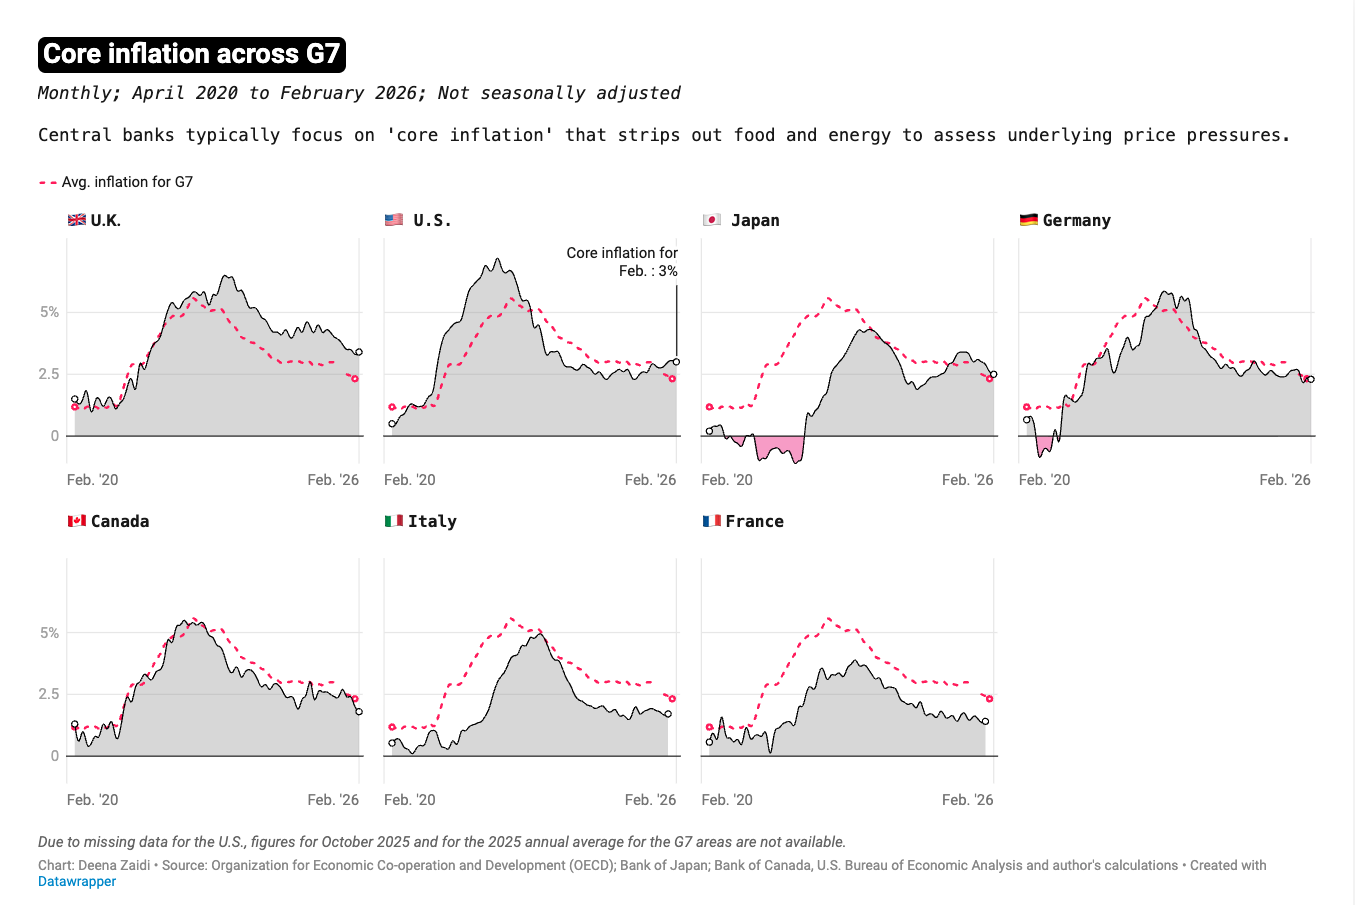
Rising oil prices are feeding inflation risks, forcing central banks to delay rate cuts despite easing geopolitical tensions.

Oil and gas might not be the only commodities vulnerable to the disruptions in the Strait of Hormuz. Fertilizers are at particular risk, as their supplies get choked at the strait, a critical shipping corridor for a third of the world’s fertilizer shipments.
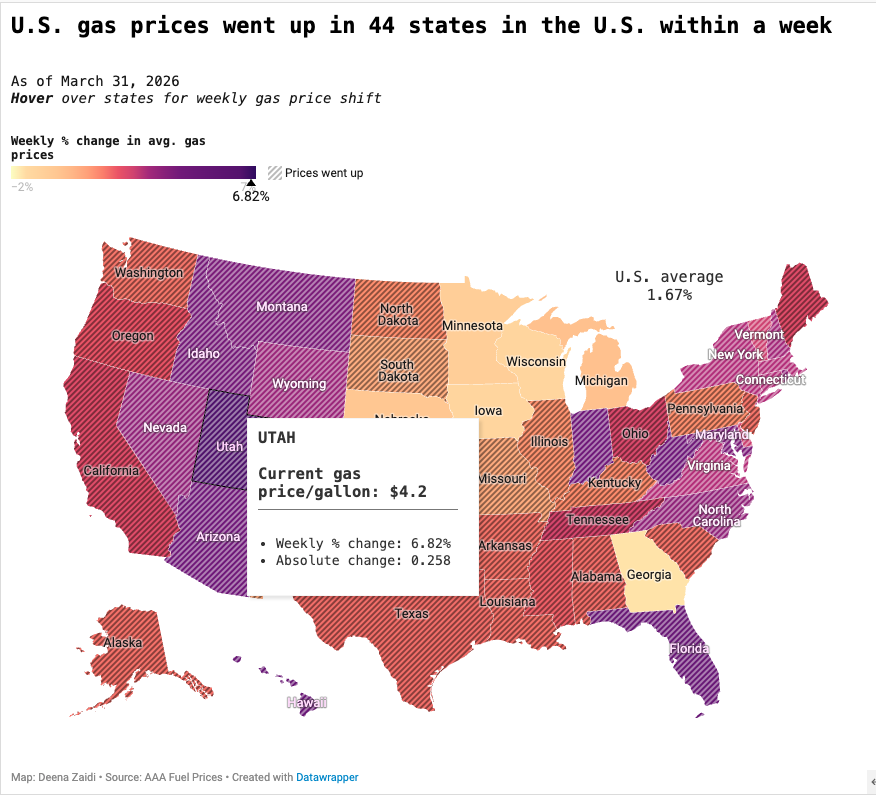
The U.S. is a net oil exporter but that does not shield it from global economic shocks.