Five Charts That Defined How the U.S. Economy Shifted in 2025

Five Charts That Defined How the U.S. Economy Shifted in 2025

In 2025, the U.S. economy didn’t simply cool or rebound but changed in ways that were visible in the data itself.
A shutdown distorted inflation, tariffs reset global trade, U.S. debt buyers quietly swapped places, and food prices surged. I pick five charts that captured how policy and politics reshaped the American economy in 2025.
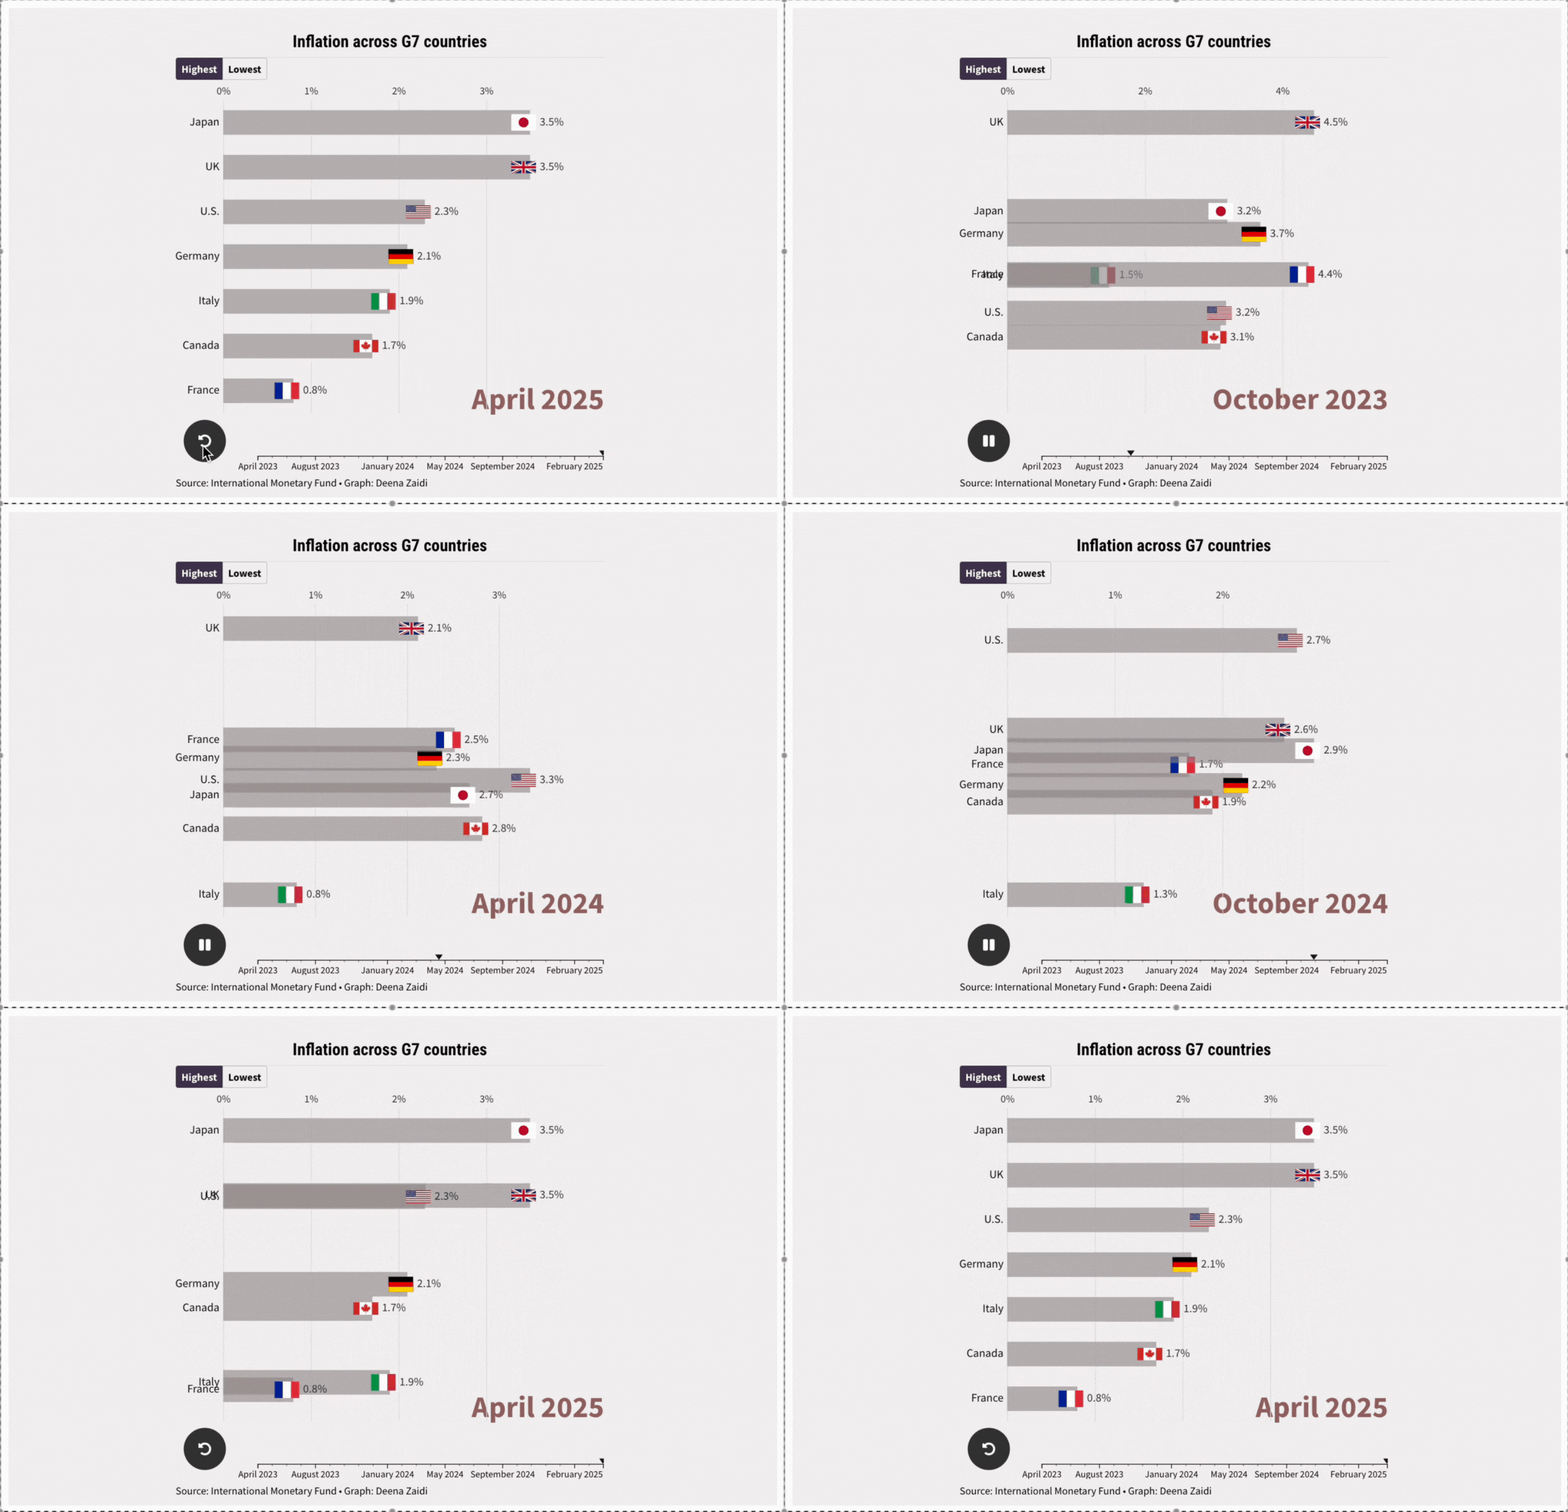
G7 inflation mapped on one graph

G7 inflation mapped on one graph

In Japan, the only Asian economy in G7,  core inflation rose at its fastest annual pace in over two years, climbing to 3.5% in April, according to data released Friday. I mapped the inflation (with some caveats) to look at the overall inflation trend in G7 economies.