Five Charts That Defined How the U.S. Economy Shifted in 2025

Five Charts That Defined How the U.S. Economy Shifted in 2025

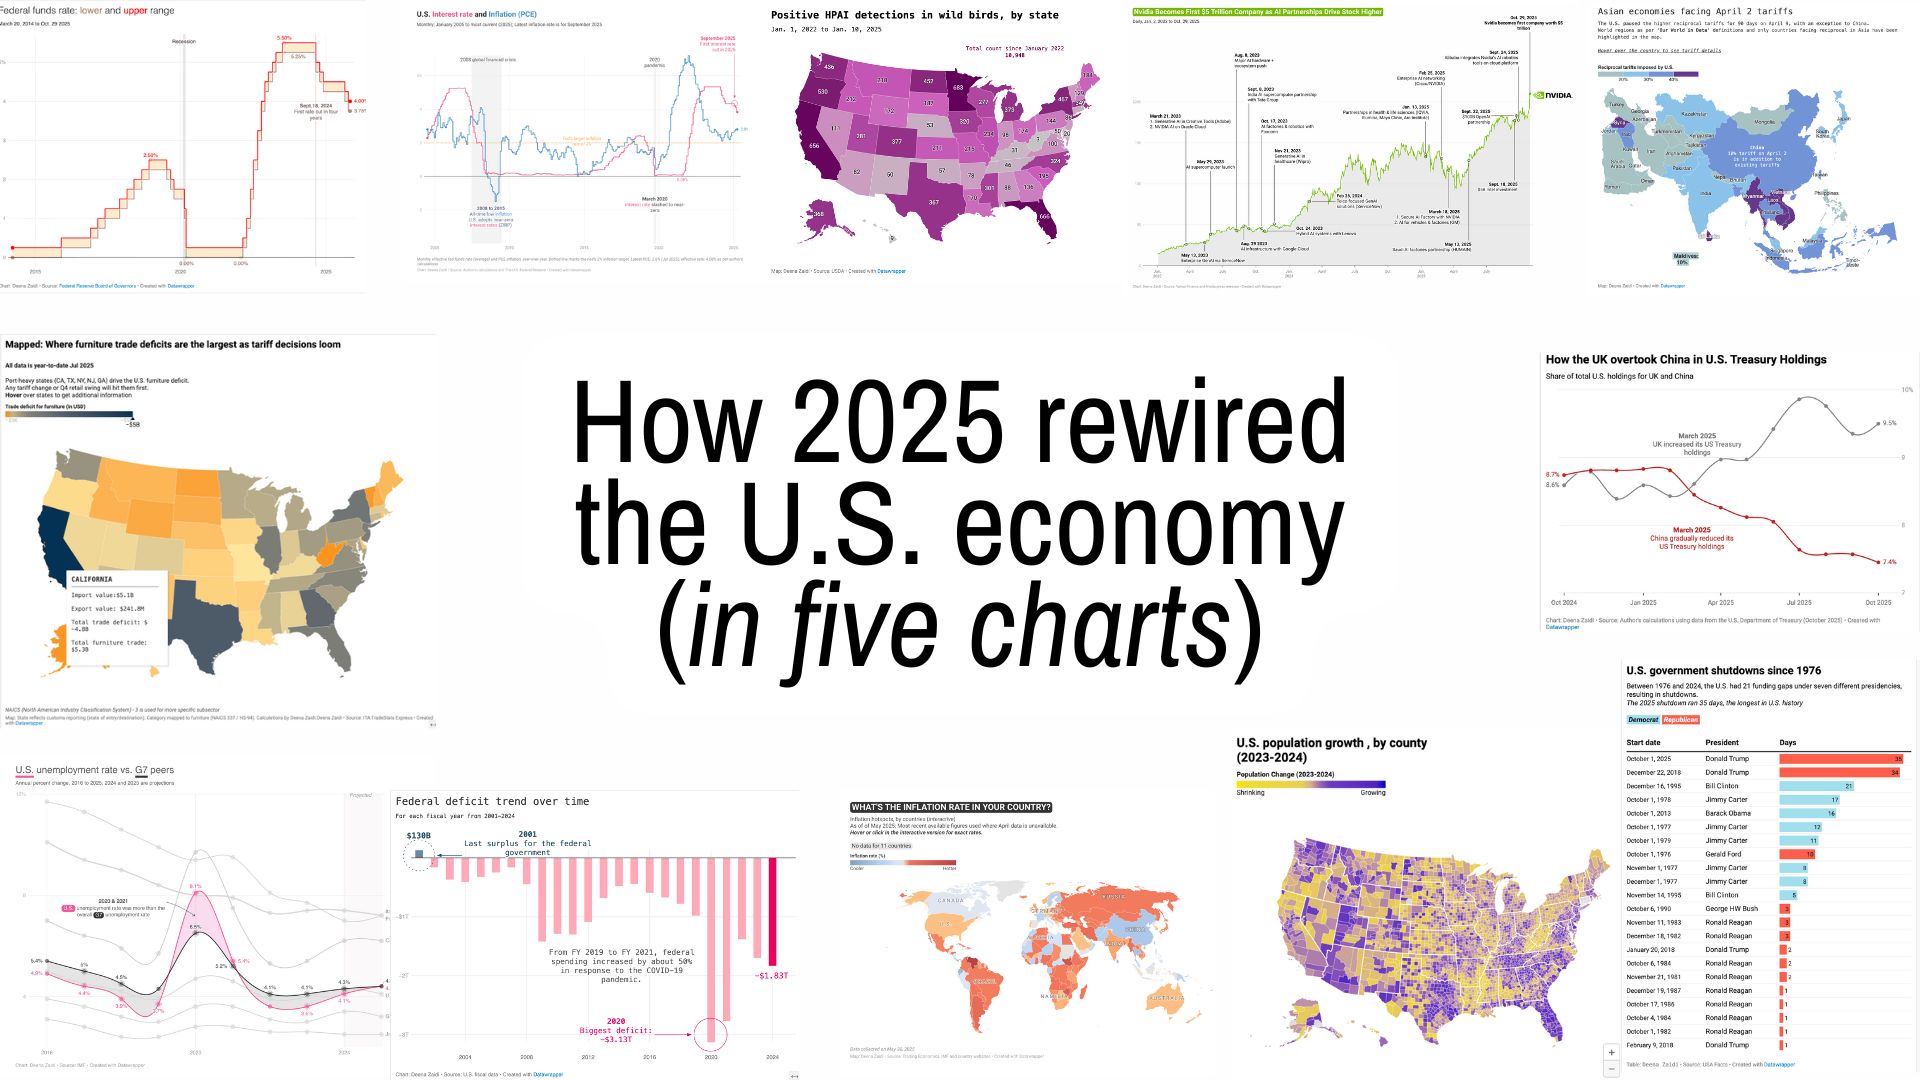
In 2025, the U.S. economy didn’t simply cool or rebound but changed in ways that were visible in the data itself.
A shutdown distorted inflation, tariffs reset global trade, U.S. debt buyers quietly swapped places, and food prices surged. I pick five charts that captured how policy and politics reshaped the American economy in 2025.

G7 inflation mapped on one graph

G7 inflation mapped on one graph

In Japan, the only Asian economy in G7,  core inflation rose at its fastest annual pace in over two years, climbing to 3.5% in April, according to data released Friday. I mapped the inflation (with some caveats) to look at the overall inflation trend in G7 economies.

Canada’s retaliatory tariffs set to take effect as Trump stands firm on trade policy

Canada’s retaliatory tariffs set to take effect as Trump stands firm on trade policy

Canada hits back with tariffs as Trump moves forward with 25% tariff on two of its largest trading partners-Canada and Mexico.

U.S. imports from Mexico, Canada and China— explained in 3 charts

U.S. imports from Mexico, Canada and China— explained in 3 charts

Trump’s second presidency comes with a series of executive actions—most focusing on making the country more self-reliant, and reducing dependence on foreign economies. We delve into the data to uncover where China, Mexico, and Canada really stand as key trading partners of the U.S. — all in just 3 charts