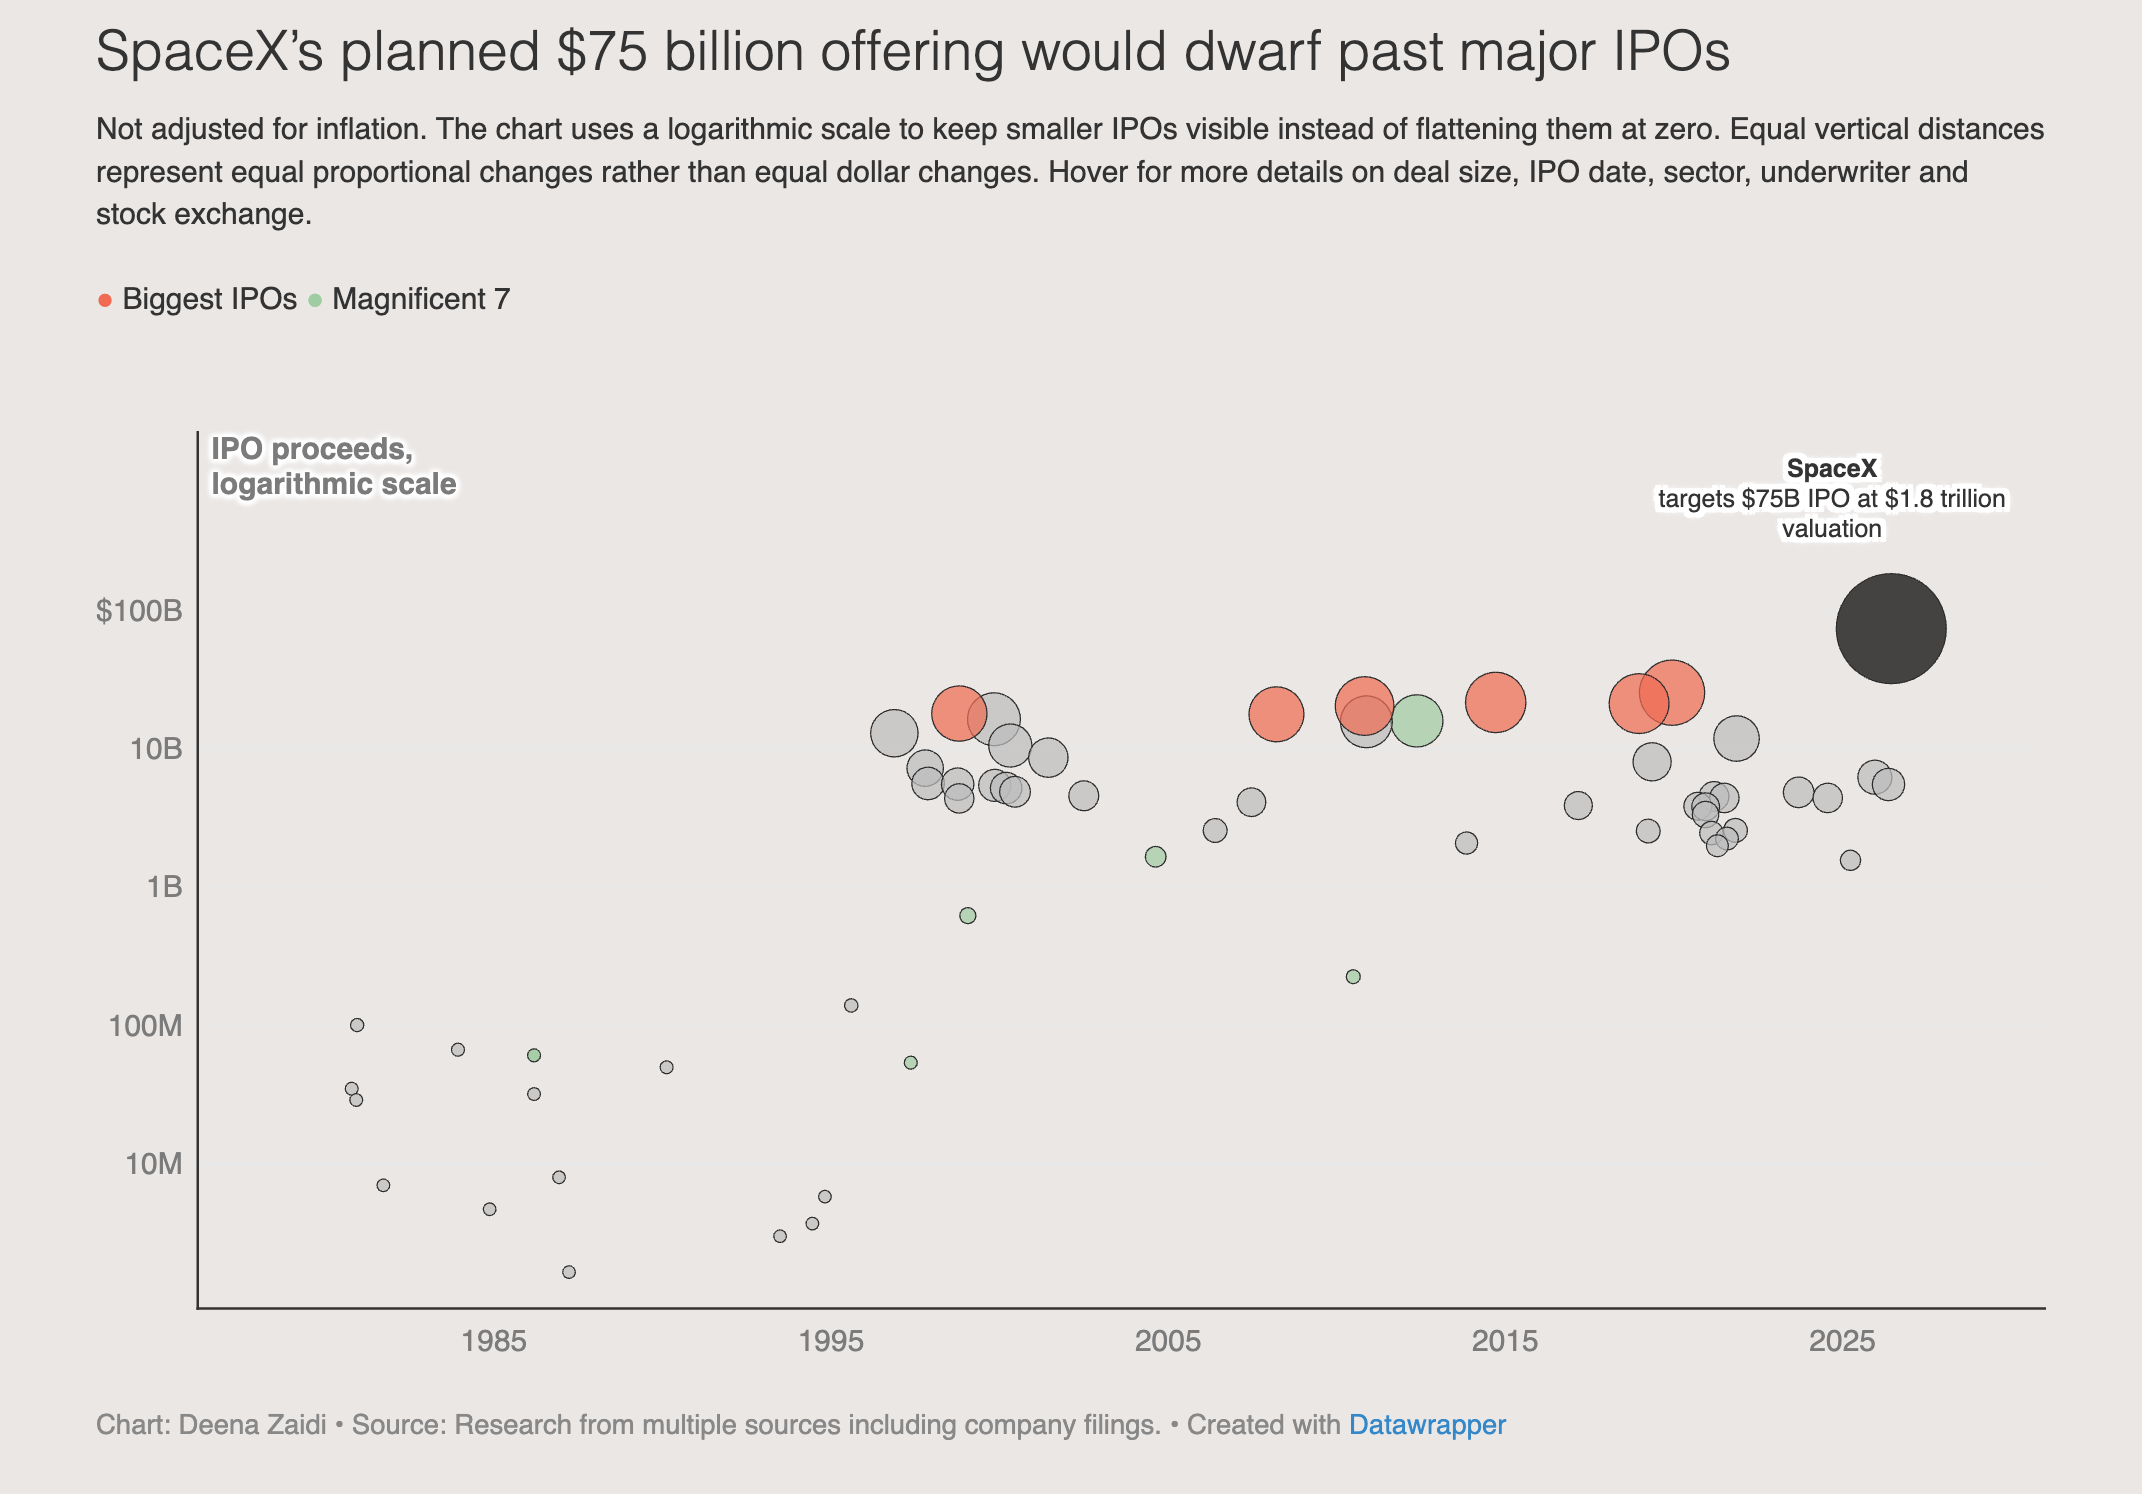
SpaceX’s planned $75 billion IPO would overshadow all IPOs in history, dwarfing Saudi Aramco, Alibaba, Meta and even the most valued company, Nvidia.
Data & financial journalist covering global economics and policy
SpaceX’s planned $75 billion IPO would overshadow all IPOs in history, dwarfing Saudi Aramco, Alibaba, Meta and even the most valued company, Nvidia.
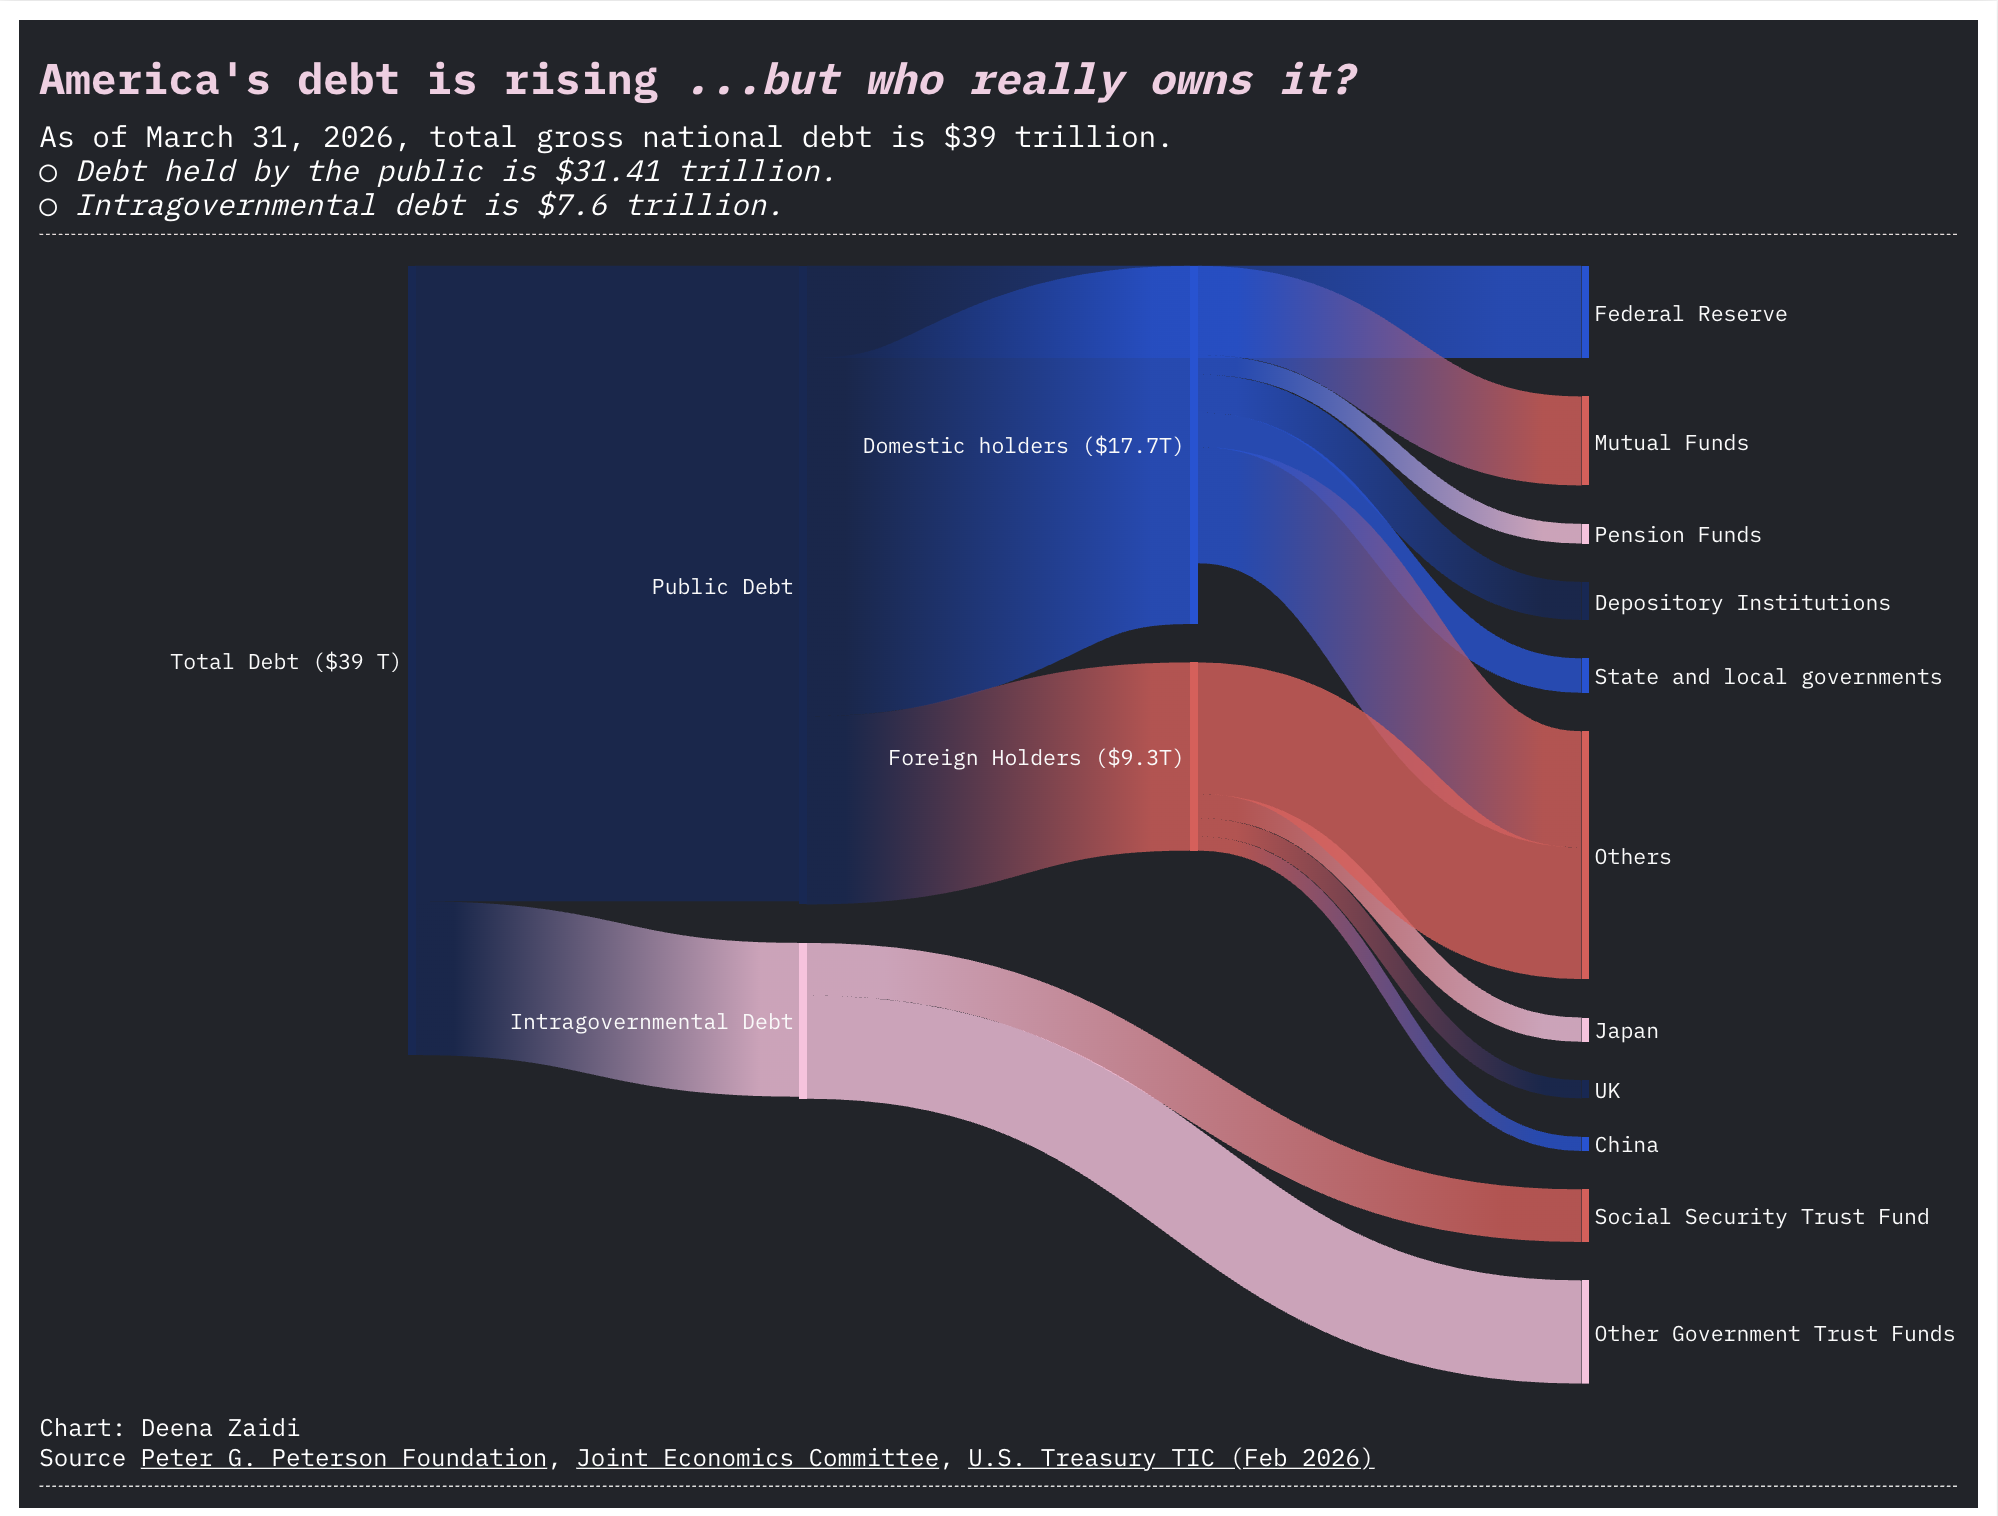
The current gross U.S debt stands at $39 trillion, which experts say is not the real problem. Instead, its the current path Congress has taken of spending more than taking in which seems “not sustainable.”

OPEC is no stranger to exits. But UAE’s exit could mean a fundamental geopolitical shift in the Middle East (and the oil markets).
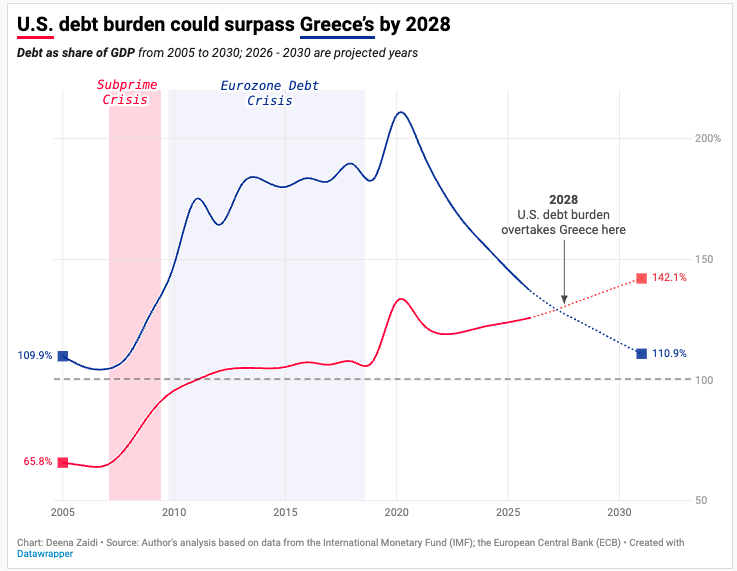
The country once mocked for fiscal collapse may soon look more disciplined than the world’s largest economy.