Comparing inflation is complex —especially if you have a diverse global economic landscape.
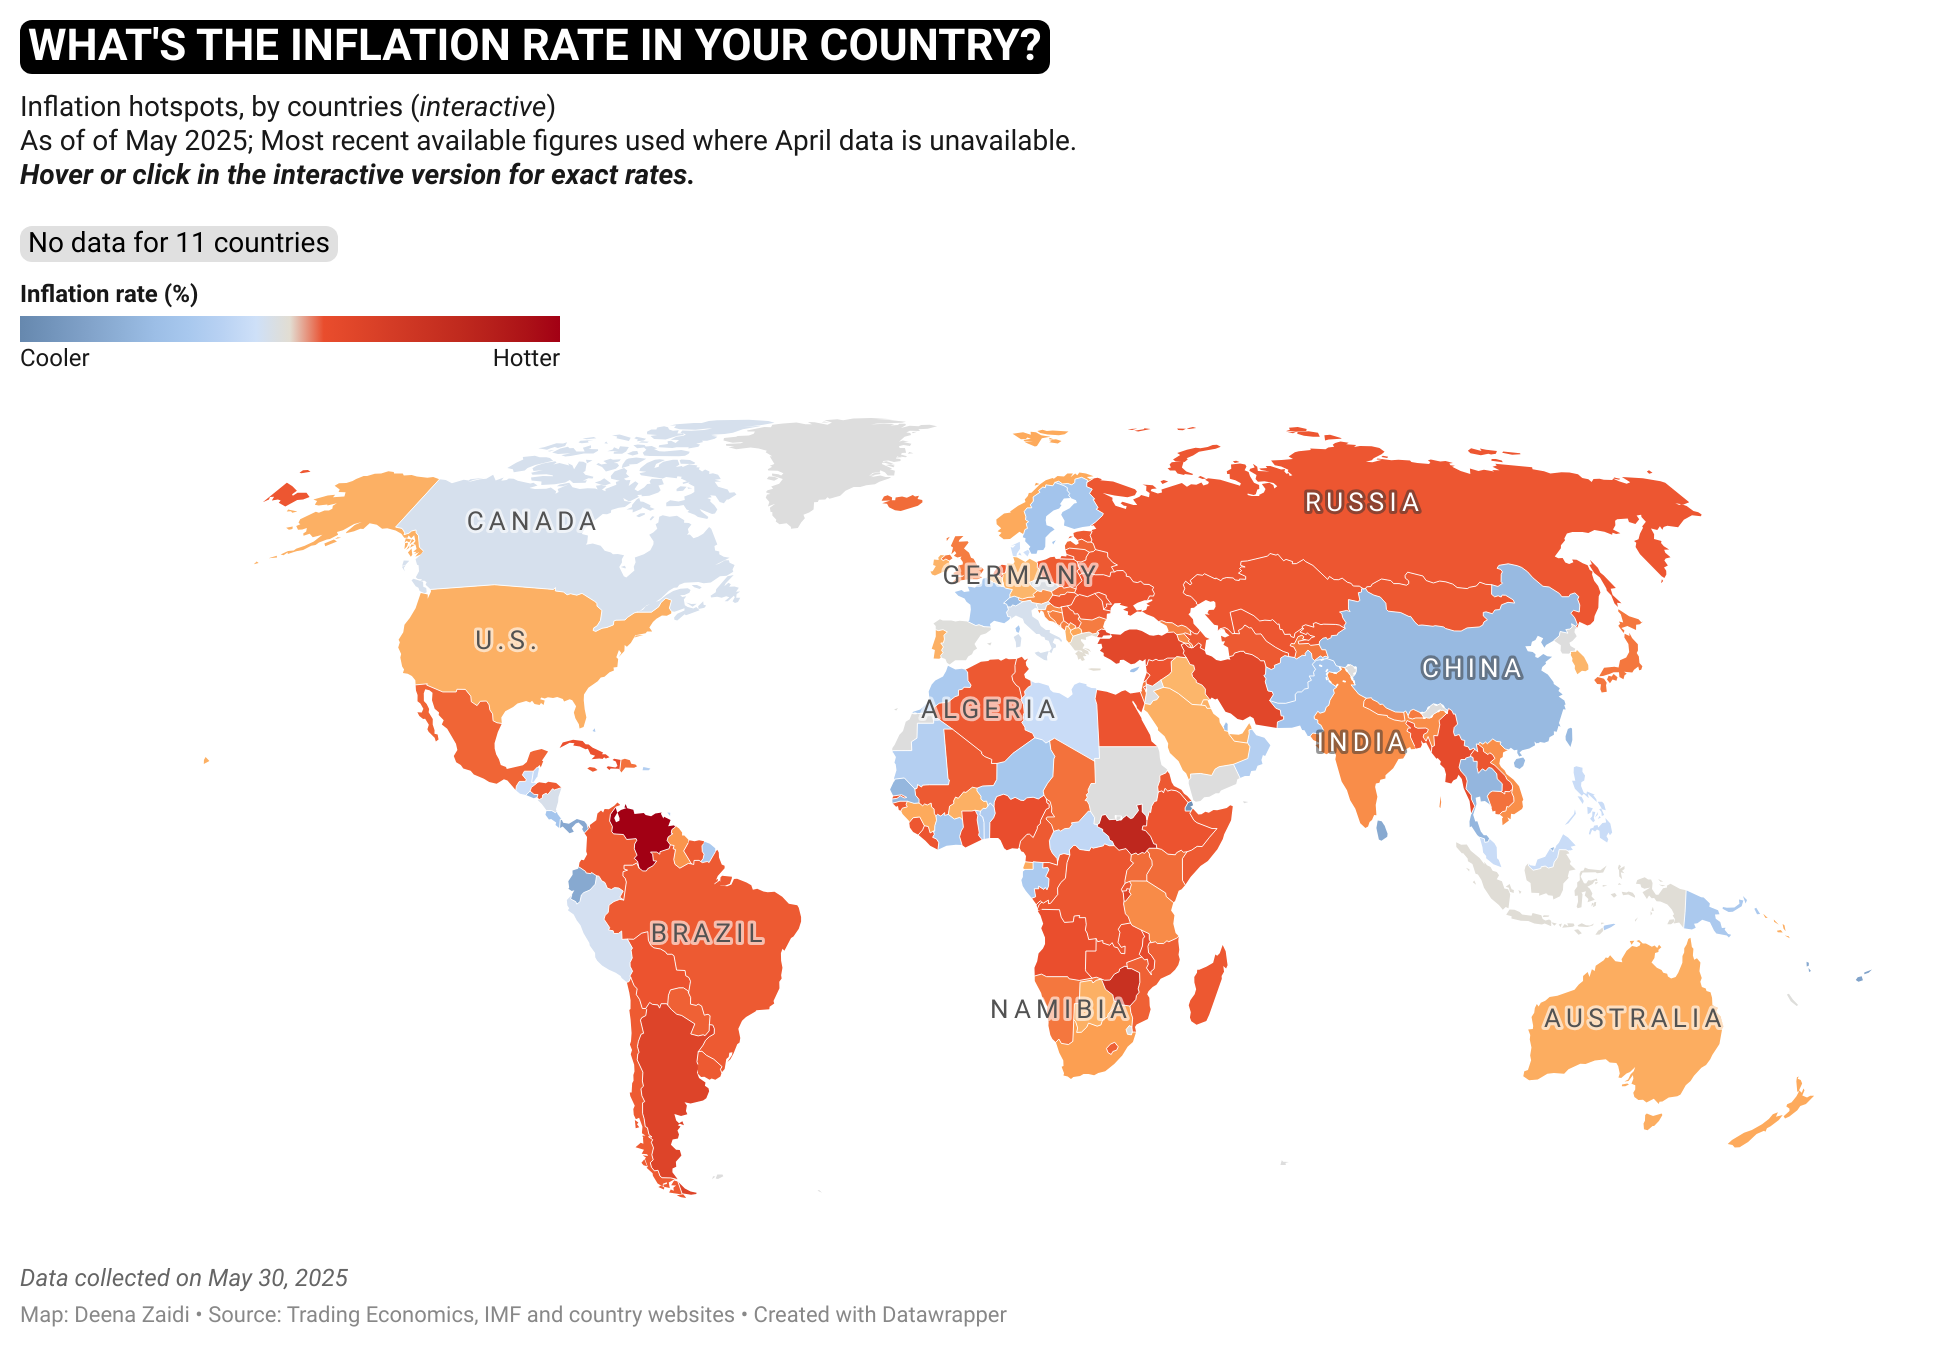
Mapping headline Consumer Price Index (CPI) across countries is a good start and can give a rough sense of where prices are rising fastest or slowest.
But it’s important to keep in mind some caveats along the way.
About the data
There are 195 countries in the world, according to the United Nations and of these, data for 93 % (181 ) has been collected from multiple sources including Trading Economics, Asian Development Bank (ADB), European Central Bank (ECB), U.S. Bureau of Labor Statistics (BLS) and government websites.
- Reference period: A look at the reference periods (when inflation was last recorded) and tried to see if the overall inflation went up or down from when it was last reported.
- World regions: For simplicity and purpose of this analysis, I have relied on world regions definitions by Our World in Data, which considers six world regions: Africa, Asia, Europe, North America, Oceania, and South America.
- Inflation range: For easier comparison, we’ve created bins ranging from below zero (deflation or very low) to above 50 (hyperinflation or extreme levels). The ranges in between have been divided in a way that best captures the metric across a global map.
Although I’ve exercised due diligence, the data carry some inherent limitations.
At this point, it is important to understand that inflation is a year-over-year change in the index and is driven largely by food and energy (at least in most countries), There is no global uniform standard for creating a CPI Index (see caveats below).
Data caveats
Each country measures CPI using cost of a “typical” basket of goods and services reflecting local consumption patterns.e.g. more rent in the U.S., more food in emerging markets
- Weighting differences: Some items (like housing or transport) may count for more weight in one country’s CPI but less weight in another’s.
- Methodological discrepancies: Different calculation methods, seasonal adjustments
- Base year: Periodical updates of the base year affects CPI index, which can impact the level.
- Reference-period: As noted in the map, not every country reports May data at the same time—so cross comparisons mixes the latest available month for each.
- Data reliability: Emerging-market statistics can sometimes be less timely or less transparent.
Overall findings
Of the 181 countries mapped, 52% saw inflation decline, 10% were stable, and 35% saw it rise.
- Even where inflation fell, levels remain high. For example, Argentina’s year-over-year rate eased from 55.9% in April to 47.3% in May but is still very high.
- About one-third (61/181, ≈34%) have inflation above 4%.
- Three countries (Venezuela, South Sudan, Zimbabwe) are in hyperinflation (> 50%).
- Roughly one-third of countries (61/181 ≈ 34 %) have inflation above 4 %
- About 34 % (or 61 countries) sit in the “elevated,” “concerning,” or “high” inflation bands (> 4 – 50 %).
- Five of its 13 countries are in that mid-range, reflecting persistent inflationary pressure even outside the single hyperinflation case.
- And as many as 3 countries (2 %) are in the hyperinflation category (> 50 %), namely Venezuela, South Sudan and Zimbabwe.
Extreme outliers
“Extreme outliers” stand apart from the rest of the globe, signaling either hyper-inflationary conditions or deflationary conditions – both of which can impact the purchasing power of a consumer.
For starters, hyper inflation occurs when the inflation reaches above 50% and deflation is when the the index is below zero.
The analysis reflects as many as 8% countries of the 181 mapped are facing inflation below zero and 2% have hyperinflation.
African countries dominate the extreme outliers, with Zimbabwe recording 91% inflation in the month of May. More than half of the countries in Africa have levels of inflation higher than 10% inflation.
But so far, Venezuela tops all the countries mapped when it comes to hyperinflation where 172% was reported for the month of May. Excessive money printing, currency devaluation, decline in oil revenues, international sanctions, and price controls and market distortions are leading contributors of Venezuela’s persistent high inflation.
Argentina’s astronomical 55.9% inflation rate in April went down to 47.3% in May but still remains one of the most severe case globally. This hyperinflation scenario reflects deep-seated economic issues, likely stemming from a combination of monetary mismanagement, political instability, and structural economic problems.
The situation in Argentina serves as a stark reminder of the devastating effects of unchecked inflation on an economy and its citizens.
Regional snapshots
Europe: No hyperinflation. Many core countries have low or moderate rates. Over half of European countries saw inflation fall month-on-month.
Turkey’s 37.86% inflation rate is alarmingly high, indicating severe economic distress. This level of inflation can lead to significant social and economic instability if not addressed promptly and effectively. Switzerland’s 0% inflation rate in April exemplifies remarkable price stability. This rate is consistent with Switzerland’s long-standing reputation for economic prudence and its status as a safe haven for global capital.
Germany, saw its inflation steady at 2.1% in May. Other European countries, registered low inflation rates, below the European Central Bank’s 2% target and indicates some economic sluggishness in the region’s core economies. In May, lowest annual rates were registered in France (0.7%), Italy (1.7%), Slovenia (1.8%) and Luxembourg (1.65%).
Highest annual rates were recorded in Romania (4.9%), Hungary and Poland (4.2%). Compared to the previous month, annual inflation fell in more than 50% of the countries in Europe.
Asia: No hyperinflation, but 15 of 47 countries have rates > 5%. Turkey (37.9%) and other high-inflation cases reflect currency and geopolitical strains.
Africa: Dominates extreme outliers; many face double-digit inflation.
Americas & Oceania: Mixed: some low-inflation economies (e.g., Canada ~2%), others with lingering high rates (e.g., Argentina).
In conclusion
Current global inflation data paints a picture of a world still grappling with the economic aftershocks of the pandemic and geopolitical tensions. As central banks and governments navigate these complex waters, their decisions will play a crucial role in shaping the global economic landscape in the coming months and years.