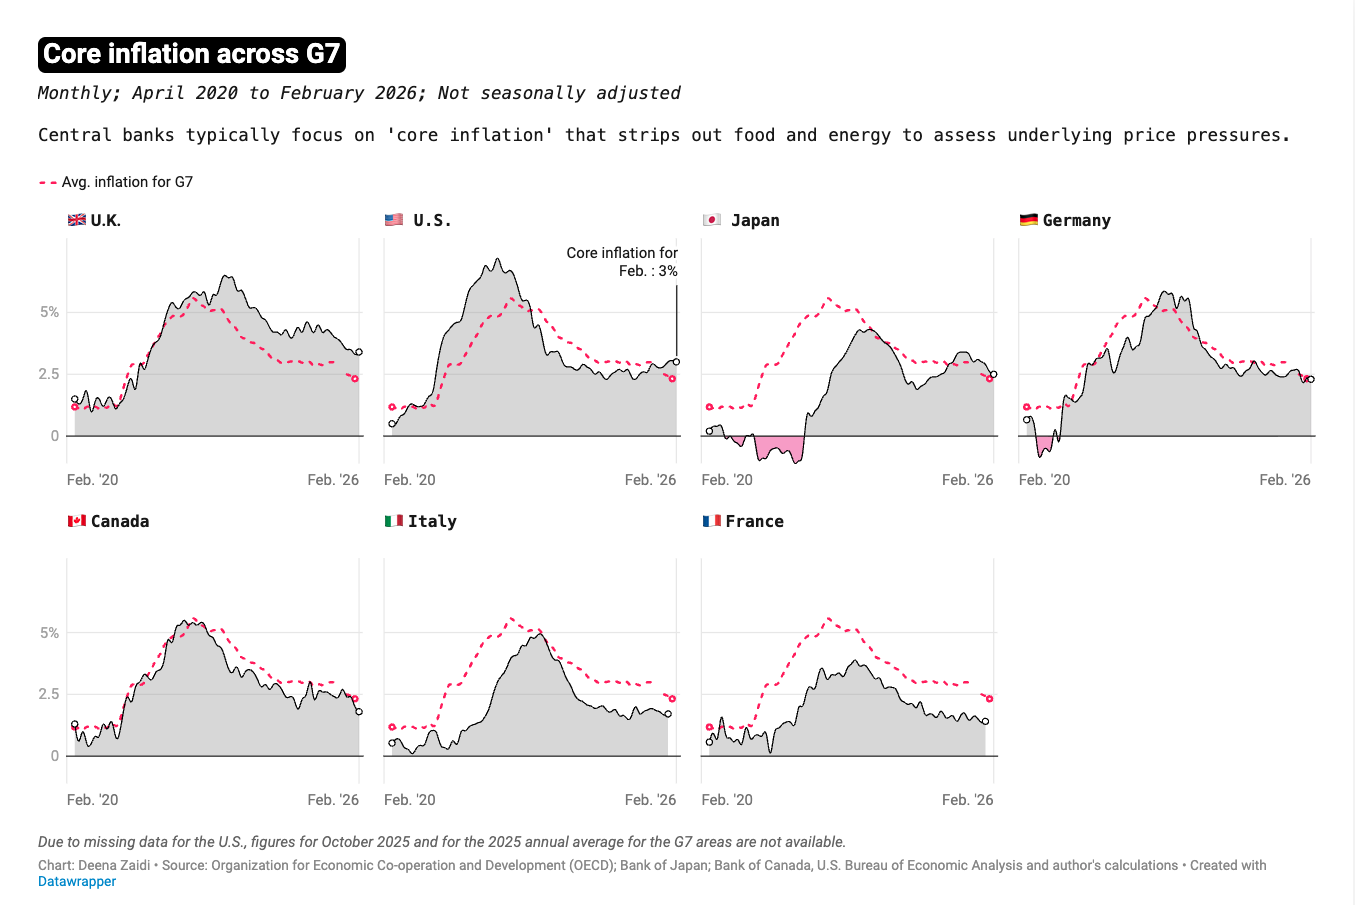
Rising oil prices are feeding inflation risks, forcing central banks to delay rate cuts despite easing geopolitical tensions.
Data & financial journalist covering global economics and policy
Rising oil prices are feeding inflation risks, forcing central banks to delay rate cuts despite easing geopolitical tensions.

Governments and energy producers are racing to protect global oil flows as risks rise around the Strait of Hormuz.
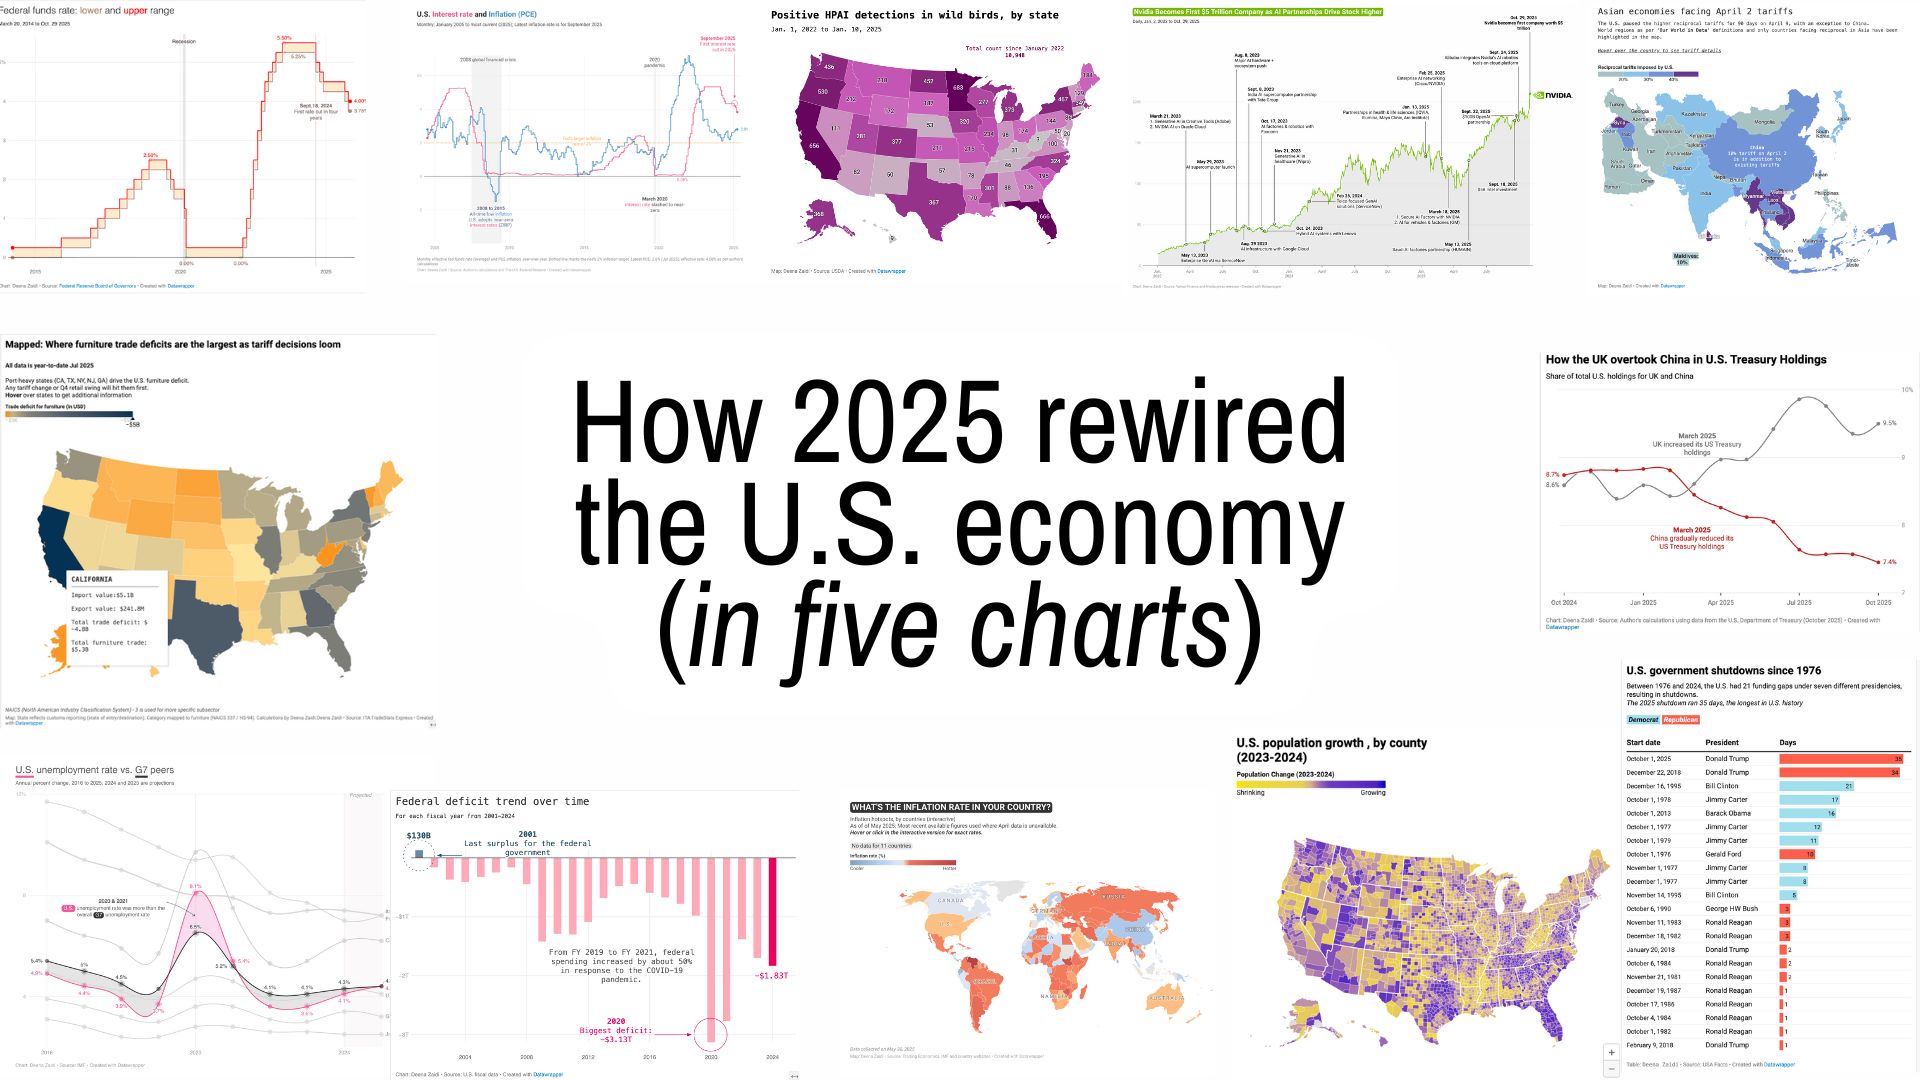
In 2025, the U.S. economy didn’t simply cool or rebound but changed in ways that were visible in the data itself.
A shutdown distorted inflation, tariffs reset global trade, U.S. debt buyers quietly swapped places, and food prices surged. I pick five charts that captured how policy and politics reshaped the American economy in 2025.
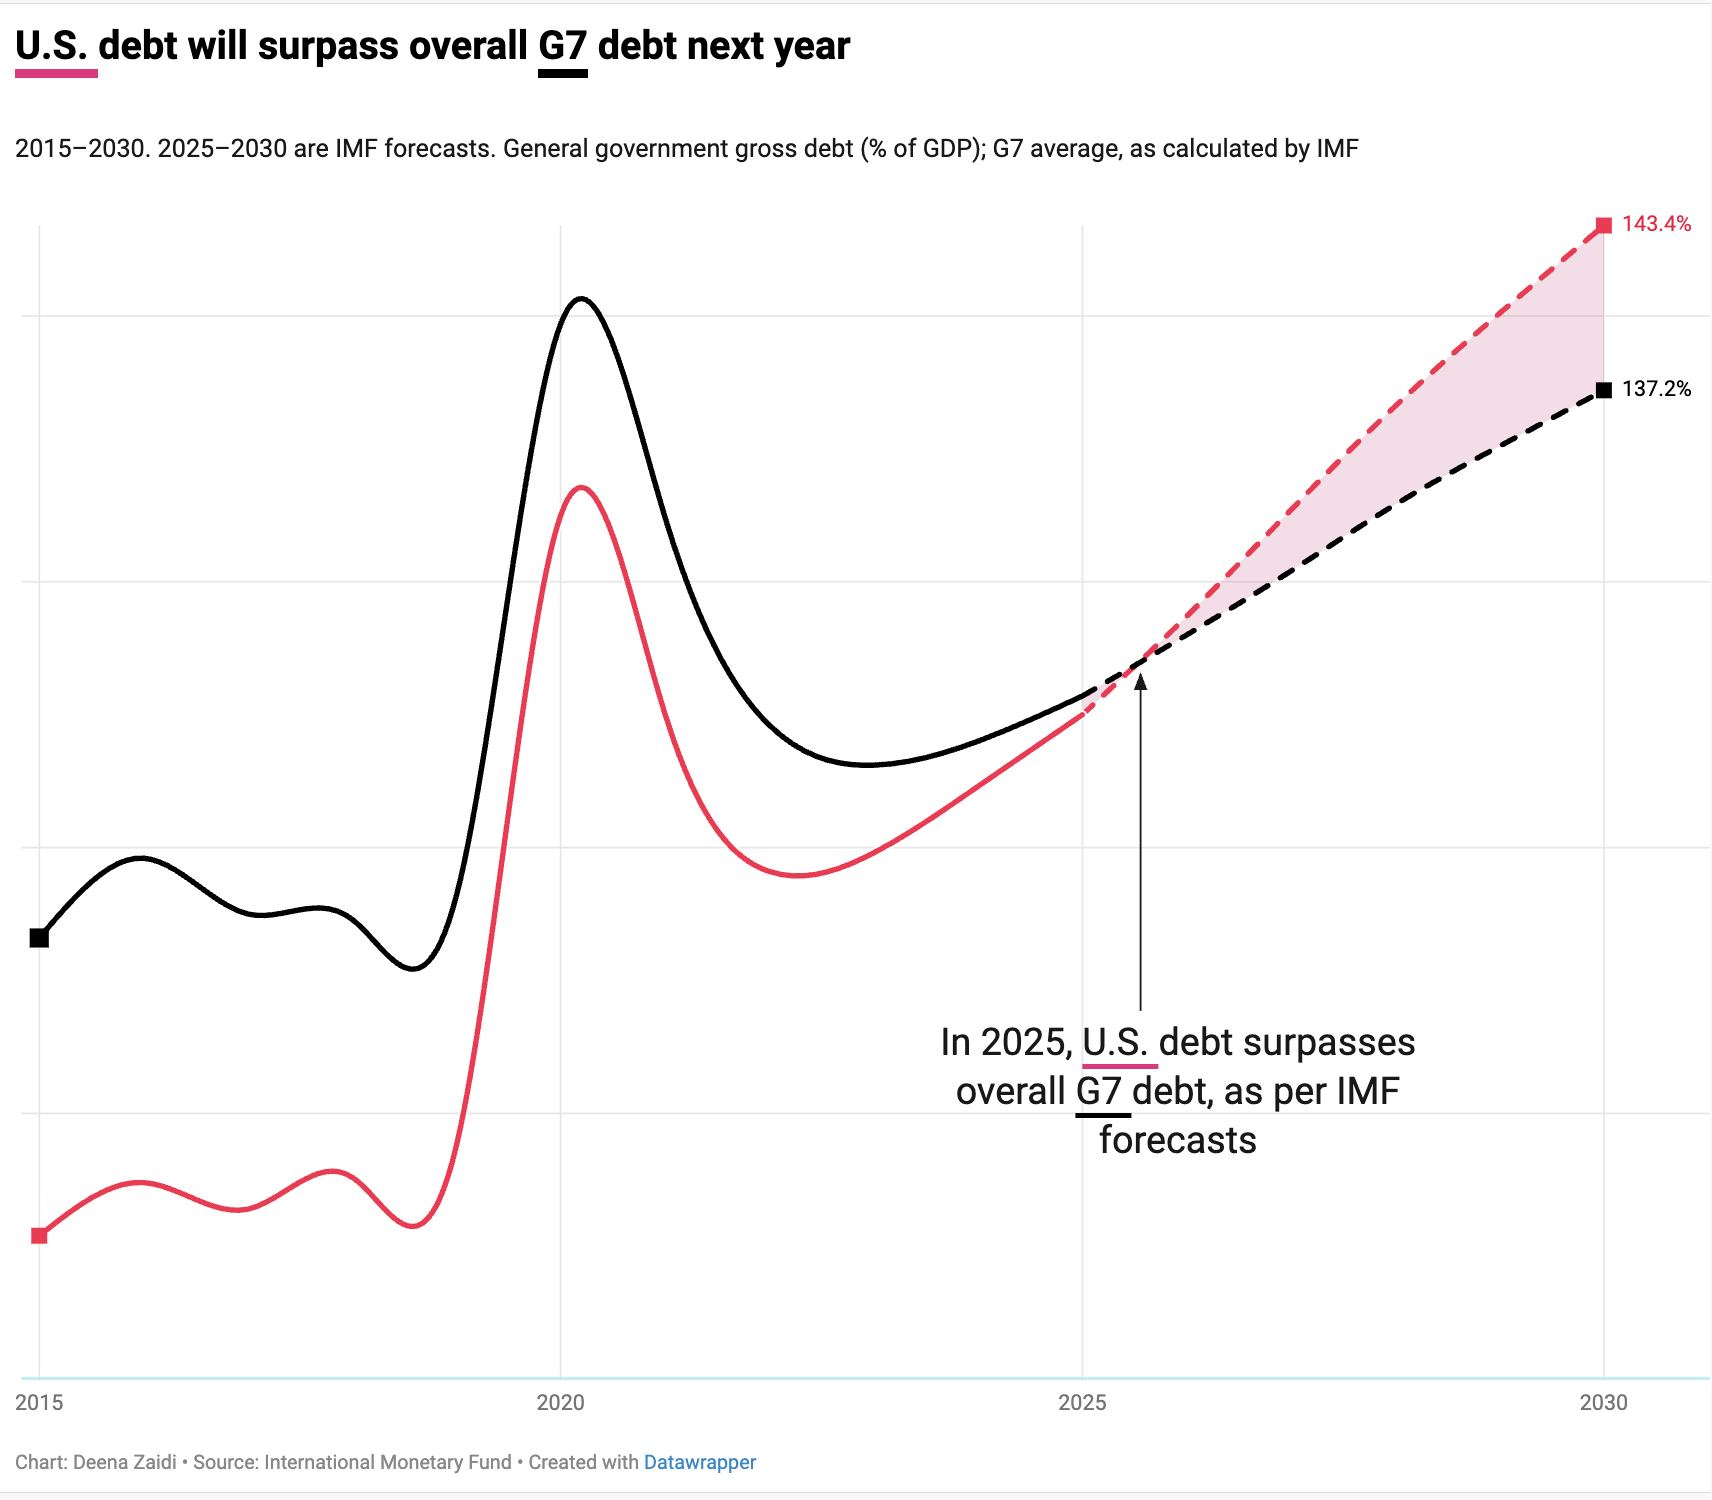
IMF projections show U.S. government debt climbing faster than most G7 peers, surpassing the group’s average in 2025 and reaching about 143% of GDP by 2030—second only to Japan.